Inventory Quality Dashboard
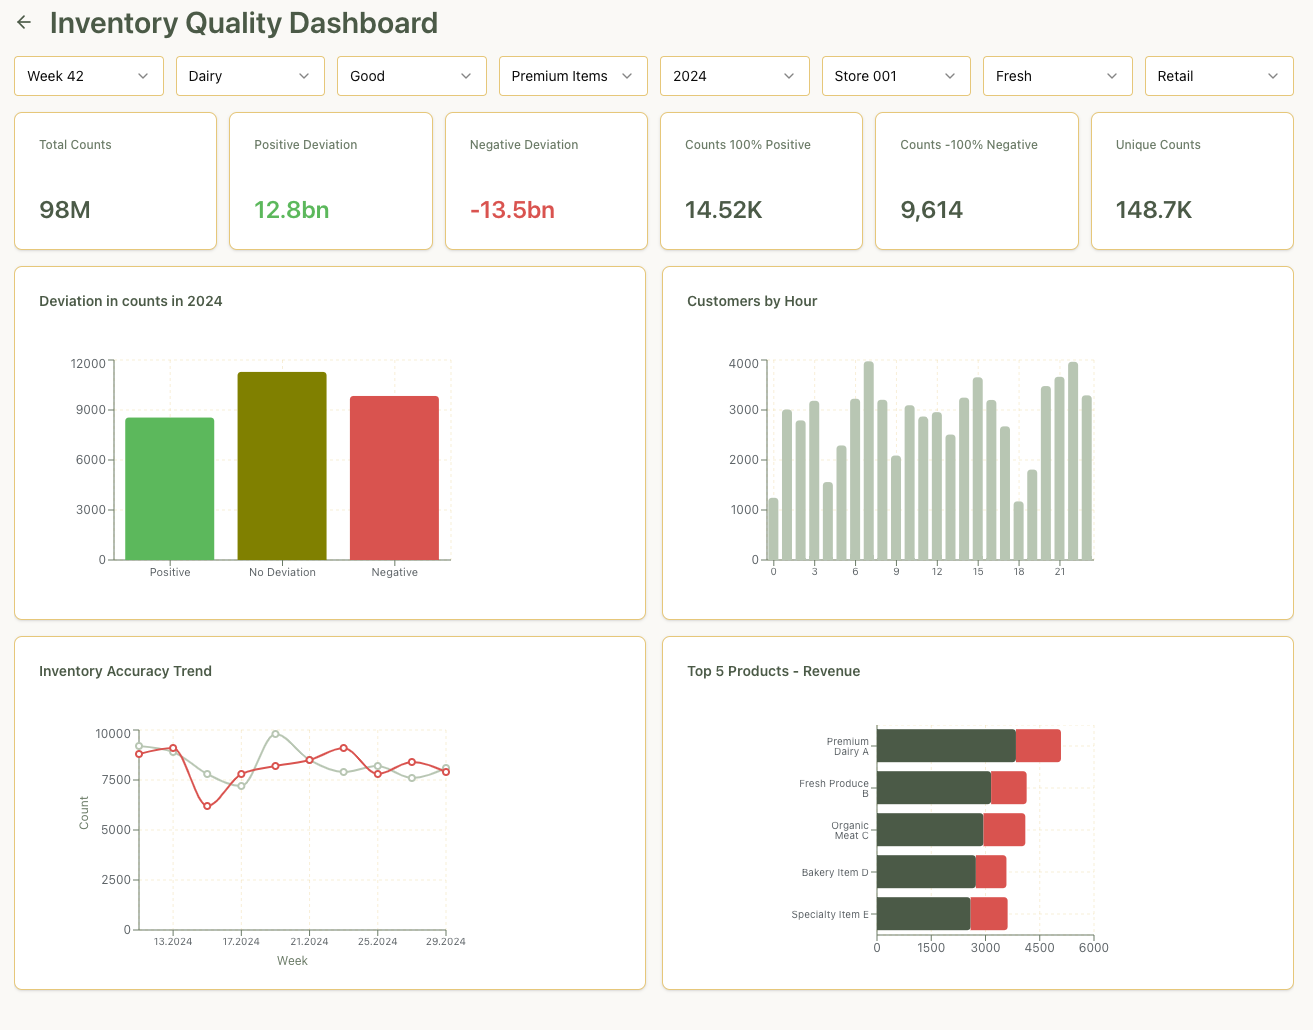
Stock-count accuracy by store and product category: positive and negative deviations, an accuracy trend and the top products by revenue.
Sample data, built for illustration
Work samples
Examples of the dashboards and reports Nereidata builds. Every sample uses sample data and was built for illustration. None of them shows data from a client.
Stock-count accuracy by store and product category: positive and negative deviations, an accuracy trend and the top products by revenue.
Sample data, built for illustration
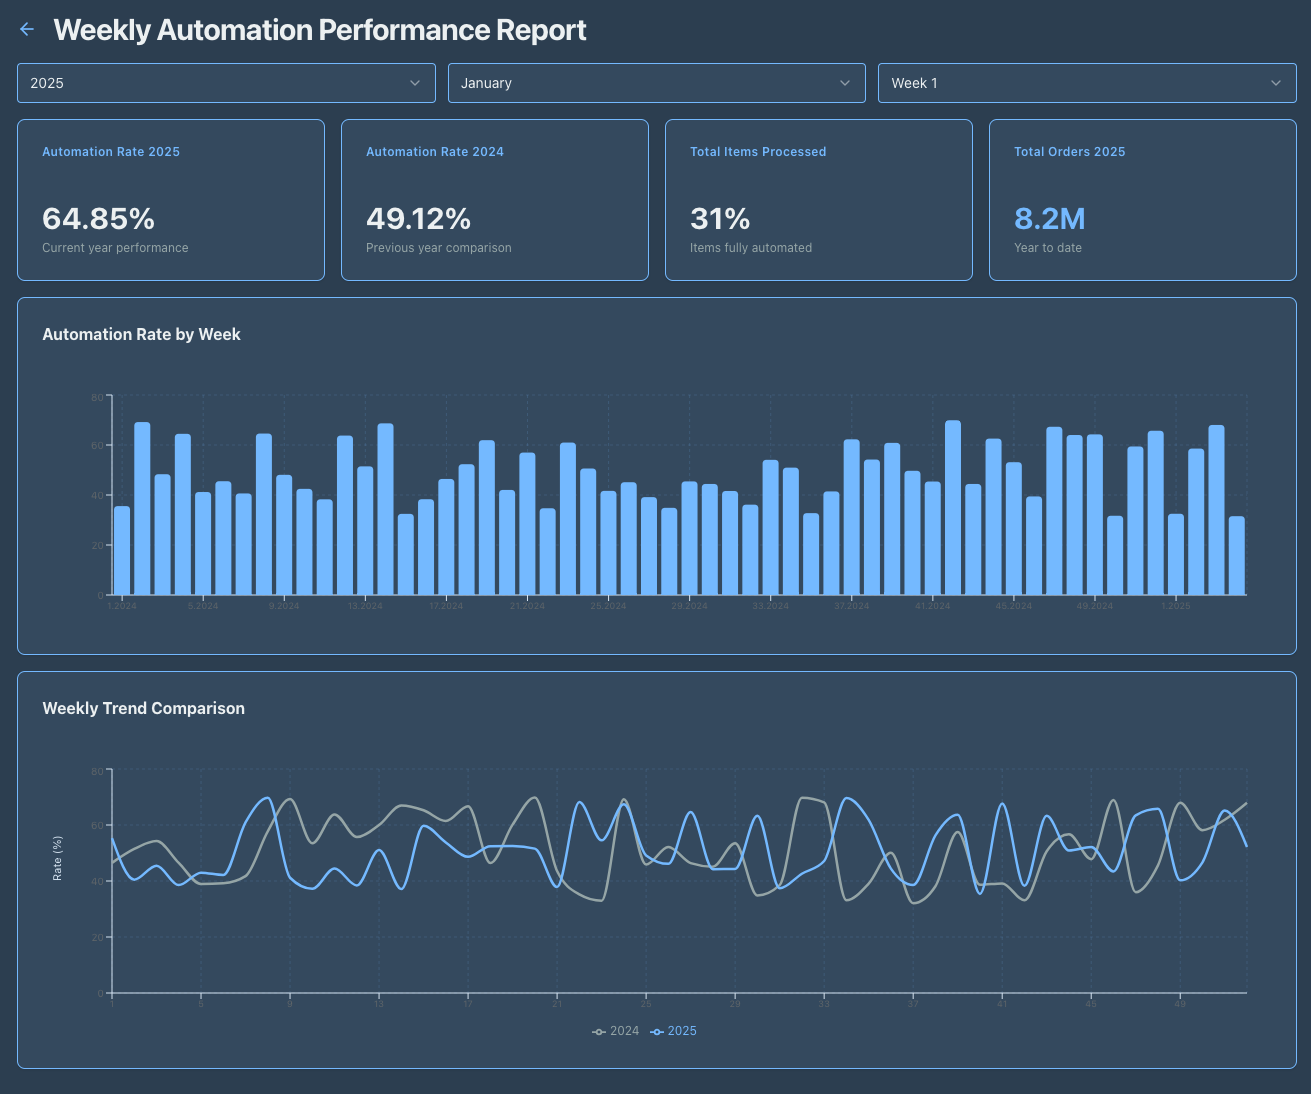
Weekly automation rate compared with the previous year, with items processed and total orders.
Sample data, built for illustration
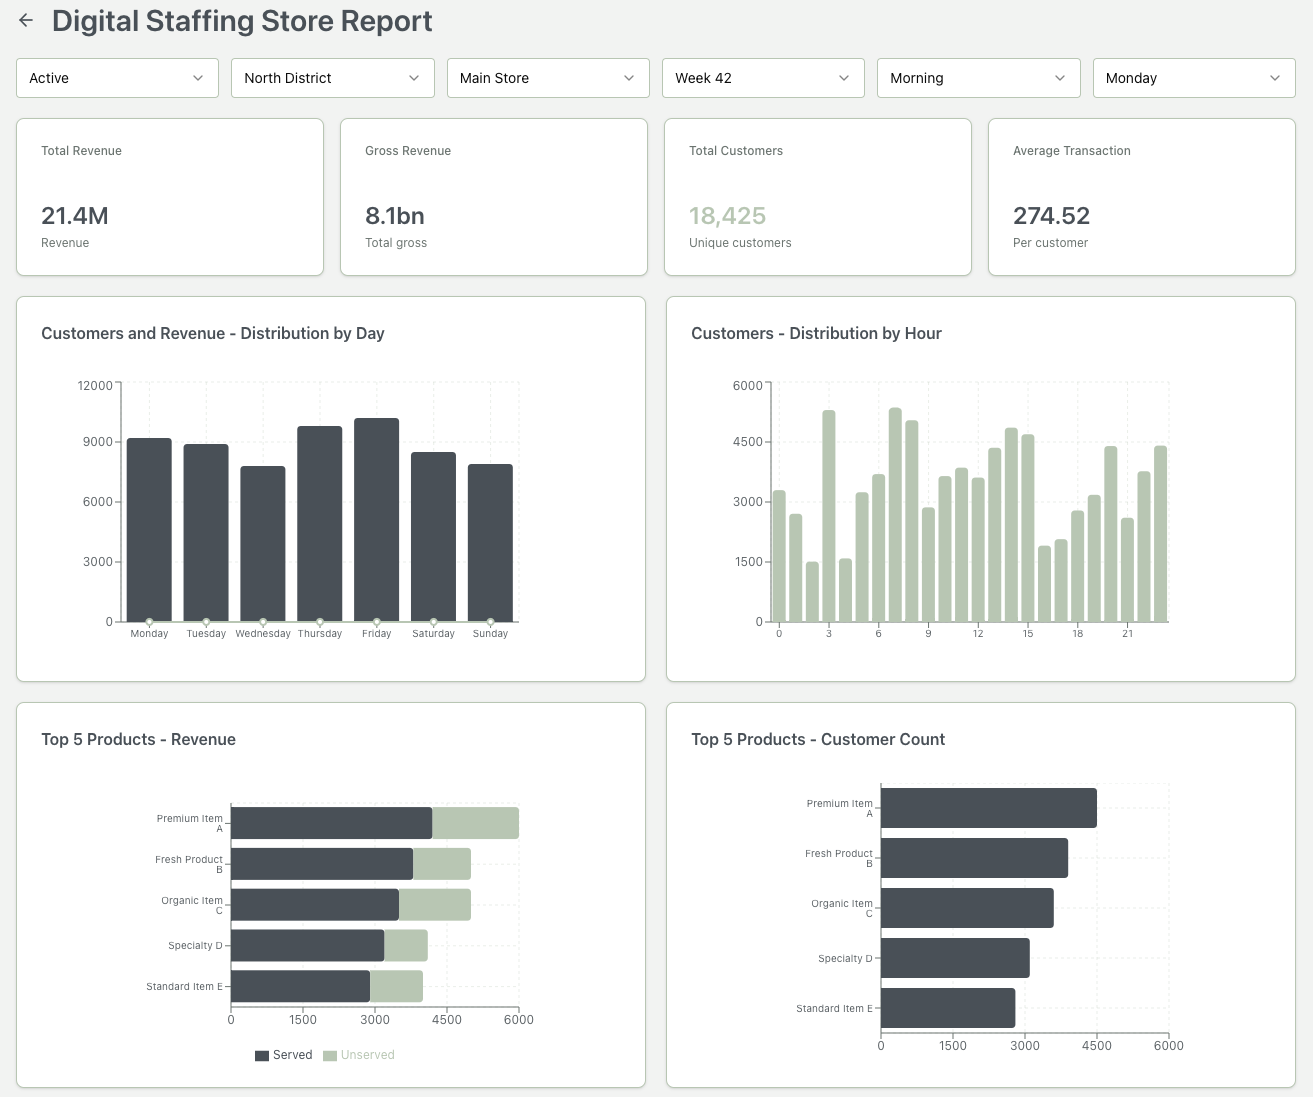
Store revenue and customer traffic by day and by hour, with top products split into served and unserved demand.
Sample data, built for illustration
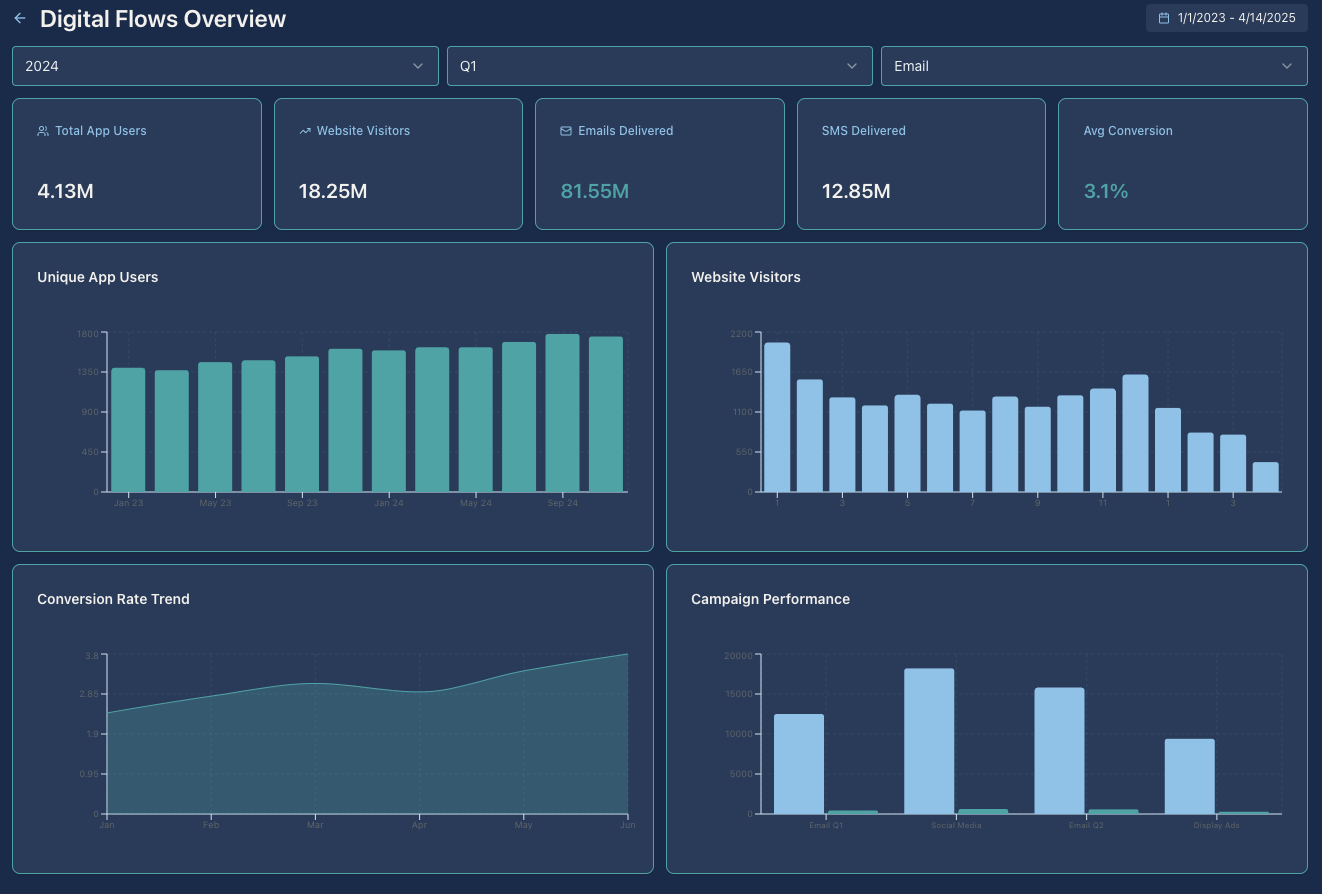
App users, website visitors, email and SMS volumes and conversion rate over time.
Sample data, built for illustration